※ 공부하는 포스팅으로 틀린 것이나 맞지 않는 표현 있을 수 있습니다. 피드백 받습니다!!
python 지도 데이터 handling 위한 라이브러리 Folium의 기본적인 사용법 코드를 돌려보았다.
python 라이브러리중 Folium은 Data wrangling(raw data를 보다 쉽게 접근하고 분석할 수 있도록 데이터를 정리하고 통합하는 과정)의 강점과 leaflet.js 라이브러리의 매핑 강점을 기반으로 구성되어있다.
사용 환경
- window10
- vscode
- jupyter notebook
버전
- python 3.10.2
- folium 0.12.1.post 1
Folium 기능
- 지도 그리기
- 마우스로 지도 움직임 & 줌인 아웃
- API와 연동
- 위치 마킹 기능
- OpenStreetMap 지원
install method
$ pip install folium
start code
1. 기본 location 중앙값 지정
|
1
2
3
4
5
|
import folium
m = folium.Map(location=[35.809747, 127.092337])
m
|
cs |
2. html 파일 저장
|
1
|
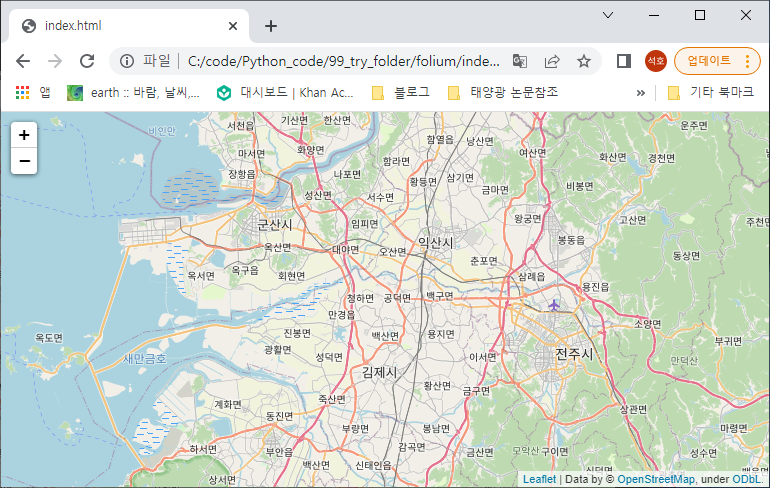
m.save("index.html")
|
cs |
위 index.html 파일의 저장 경로를 복사하여 웹 브라우저로 열면 다음과 같다.
3. zoom start 지정
|
1
|
folium.Map(location=[35.809747, 127.092337], zoom_start=13)
|
cs |
처음 code 시작 시 지도의 추적 단계 지정
basic -> zoom_start=10
min_zoom=0
max_zoom=18

4. 지도 크기 설정
|
1
2
3
4
|
m = folium.Map(location=[35.809747, 127.092337],
width=750, height=500,
zoom_start=13)
m
|
cs |

5. 지도 형식 변경
|
1
2
3
|
m = folium.Map(location=[35.809747, 127.092337],
zoom_start=12,
tiles="Stamen Terrain")
|
cs |
tiles 인자 값 예시
- “OpenStreetMap”
- “Mapbox Bright” (Limited levels of zoom for free tiles)
- “Mapbox Control Room” (Limited levels of zoom for free tiles)
- “Stamen” (Terrain, Toner, and Watercolor)
- “Cloudmade” (Must pass API key)
- “Mapbox” (Must pass API key)
- “CartoDB” (positron and dark_matter)
6. 다른 API와 연동
|
1
2
3
4
|
folium.Map(location=[45.5236, -122.6750],
zoom_start=13,
tiles='Mapbox',
API_key='your.API.key')
|
cs |
-> 실행 안 해봄!
Mapbox 회사는 지도와 관련된 다양한 오픈소스 서비스를 제공하며 우리가 원하는 지도로 커스텀할 수 있게 지원을 해주는 것 같다.
7. 마커 이용
- 기본
|
1
2
3
4
5
6
7
8
9
|
m = folium.Map(location=[35.809747, 127.092337], zoom_start=12, tiles="Stamen Terrain")
tooltip = "Click me!"
folium.Marker(
[35.809747, 127.092337], popup="<i>학교</i>", tooltip=tooltip
).add_to(m)
m
|
cs |
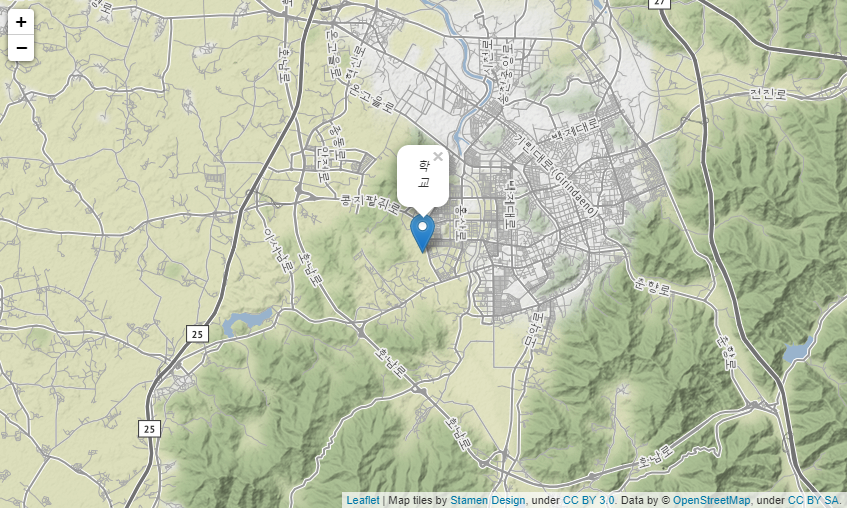
Marker 매소드를 이용 마커를 표시하고 popup인자로 간단한 정보를 넣어서 띄울 수 있는 것 같다. 또한 처음 지도를 그린 m 객체에 마커를 그린 것을. add_to()를 이용하여 추가한다.
- 마커 색 변경
|
1
2
3
4
5
6
7
8
9
10
11
12
13
14
15
|
m = folium.Map(location=[35.809747, 127.092337], zoom_start=13, tiles="Stamen Terrain")
folium.Marker(
location=[35.809747, 127.092337],
popup="학교",
icon=folium.Icon(icon="green"),
).add_to(m)
folium.Marker(
location=[35.8, 127.09],
popup="other place",
icon=folium.Icon(color="red"),
).add_to(m)
m
|
cs |
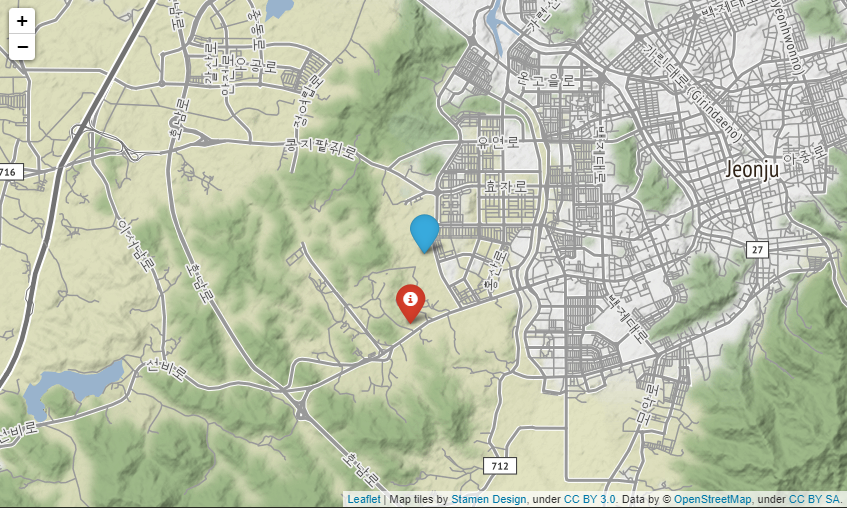
icon 인자 값으로 마커의 색을 변경한다.
- 원 그리기
|
1
2
3
4
5
6
7
8
9
10
11
12
13
14
15
16
17
18
19
20
|
m = folium.Map(location=[35.809747, 127.092337], tiles="Stamen Toner", zoom_start=15)
folium.Circle(
radius=30,
location=[35.809747, 127.092337],
popup="The Waterfront",
color="crimson",
fill=False,
).add_to(m)
folium.CircleMarker(
location=[35.809240, 127.094369],
radius=5,
popup="Laurelhurst Park",
color="#3186cc",
fill=True,
fill_color="#3186cc",
).add_to(m)
m
|
cs |
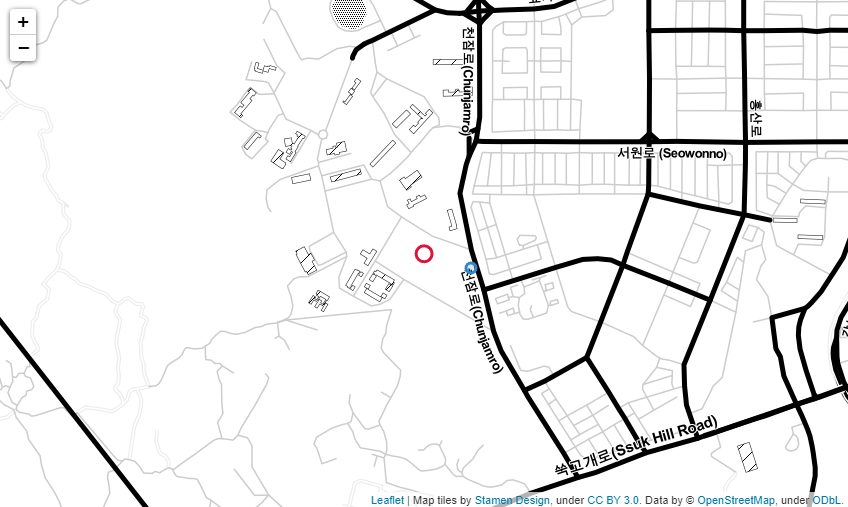
지도상에 원을 그리기 위해 두 개의 메서드를 이용한다. 원의 크기를 radius 인자로 정하고, 색은 color 인자로 원의 내부 색 채우기 fill 인자로 내부 색은 fill_color 인자로 정할 수 있다. 두 메서드의 차이점은 Circle 메서드는 지도의 확대 축소에 따라 원도 크기가 변하며 CircleMarker 메서드는 지도의 확대 축소에도 원의 크기는 변하지 않는 특징을 가진다. (직접 실행해서 보는 것을 추천ㅜㅜ)
다른 추가적인 이용방법은 Reference를 참고하여 진행해 보시는 것을 추천합니다.
Reference
Folium — Folium 0.12.1 documentation
folium builds on the data wrangling strengths of the Python ecosystem and the mapping strengths of the leaflet.js library. Manipulate your data in Python, then visualize it in on a Leaflet map via folium. Concepts folium makes it easy to visualize data tha
python-visualization.github.io
folium — Folium 0.12.1 documentation
folium Make beautiful, interactive maps with Python and Leaflet.js class folium.folium.GlobalSwitches(no_touch=False, disable_3d=False) Bases: branca.element.Element class folium.folium.Map(location=None, width='100%', height='100%', left='0%', top='0%', p
python-visualization.github.io
Folium Map Tiles - deparkes
Improve the look of your map by changing the map tiles in folium. Folium map tiles are easy to change and there are some nice looking free ones.
deparkes.co.uk
'python' 카테고리의 다른 글
| [python] 파이썬 자습서 2. 파이썬 인터프리터 사용하기 (0) | 2022.06.17 |
|---|---|
| [python] 파이썬 자습서 1. 입맛 돋우기 (0) | 2022.06.15 |
| [python] docx 라이브러리 이용기 (0) | 2022.06.14 |
| [python] shebang line (0) | 2022.05.17 |
| [python] 파이썬 자습서 0. (1) | 2022.05.14 |